
Load testing your applications using Azure Load Testing, JMeter and GitHub Actions
I’ve been working with more customers that are starting to take testing (unit, integration, end to end and load testing) more seriously. You may ask, “Dom, really? I thought testing was trivial”. Unfortunately not. As we’re entering an era where businesses are producing software like never before, relatively speaking, these businesses are not software companies. They are seeking to prioritize the speedy creation of business value while disregarding the importance of testing. Development teams, most often than not, are under pressure when the applications they develop do not perform the way they intended it to work, after being released. Testing is not engrained within their DNA. If it would have been, the extra stress and anxiety associated with debugging the problems post release would be mitigated.
Testing is a critical part of the Software Development Lifecycle (SDLC). Load testing, unfortunately, is a type of testing that not many are aware of. What is the maximum number of users that the application or system can handle before performance is impacted? How does the application or system behave under peak loads and sustained loads? What are the areas of the application or system that are most impacted by increased load? Those questions are only the start of a conversation which can be answered when doing load testing.
From experience, many are not aware of load testing because many businesses are not equipped to perform these types of tests. Development teams do not have the proper tools to simulate load. This is why I’m really excited that Azure introduced the Azure Load Testing service. Azure Load Testing is a fully managed load-testing service that enables you to generate high-scale load. The service simulates traffic for your applications, regardless of where they’re hosted.
The Azure Load Testing service comes with a quick test screen when using the UI. In this post, we will be load testing using Azure Load Testing JMeter capability. Apache JMeter is a Java application designed to load test functional behavior and measure performance. JMeter allows us to configure much more advanced load testing scenarios.
One great advantages of using the service is the fact that Azure Load Testing service allows us to have a maximum of, as of the time of writing, 45 engines running in parallel. Their recommendation is to have 250 threads per engine (think of threads as virtual users), however this is actually a soft limit – you can use the engine health metrics to monitor the load on the instances and adjust the number of threads accordingly. This means that you can have a multitude of simultaneous users on your application at one time. Quite difficult to achieve unless you have real traffic!
To get started, I will give a light introduction on the JMeter concepts and go on by creating a basic test plan to load test a sample application I’ve put together. I will then show you how to run this test through a GitHub Action workflow. This flow and setup can help you in your regression testing.
JMeter
As mentioned previously, JMeter is a Java application designed to load test functional behavior and measure performance. It uses a GUI to design the tests. The plan is saved in a JMX file which is a XML based file that contains all the test structure.
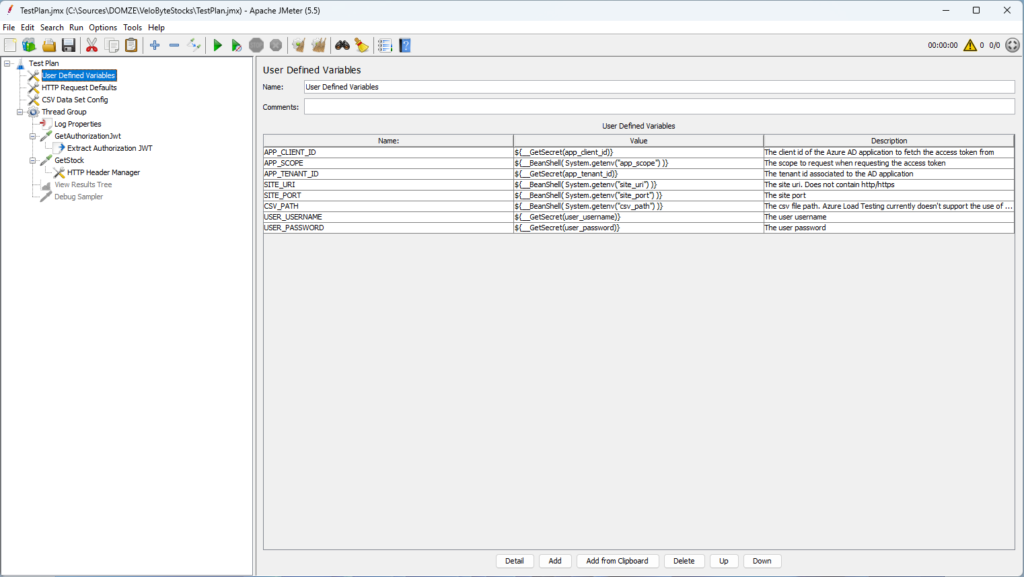
The following image shows the JMeter test plan in the GUI. In this post, I’ll show you how you can create this plan and explain the sections and objects used.
Basic JMeter concepts
JMeter can be very intimidating when you first want to create a test plan. You’d think it is fairly simple to get started but then you are presented with a variety of options, it makes you scratch your head. Here are some concepts you should be aware when you work with the tool.
Thread group: beginning point of any test plan. Defines a pool of users that will execute a particular test case against your server. You can control the number of users simulated (number of threads), the ramp up time (how long it takes to start all the threads), the number of times to perform the test, and optionally, a start and stop time for the test
Sampler: tells JMeter to send requests to a server and wait for a response. They are processed in the order they appear in the tree. For example, a sampler can be a HTTP request, TCP request, etc. There’s a special sampler, called the Debug sampler that acts a bit differently, in that it generates a sample containing the values of all JMeter variables and/or properties to help debug your samplers.
Assertion: used to perform additional checks on samplers responses received from the server, and are processed after every sampler in the same scope. View it like a unit test assertion, where you could assert that the returned status code is 200.
Listener: provides access to the information JMeter gathers about the test cases while JMeter runs. View it as an object that is used to “listen” to the results of the samplers. They are processed at the end of the scope in which they are found.
Configuration element: used to set up defaults and variables for later use by samplers. They are processed at the start of the scope in which they are found, i.e. before any samplers in the same scope.
Pre-Processor: executes some action prior to a Sampler Request being made.
Post-Processor: executes some action after a Sampler Request has been made. An example is a JSON extractor post-processor, which can extract data from a JSON request.
JMeter plans are scoped
The objects that you create are applied or executed using the tree hierarchy under the scope they belong (i.e. the assertion under the HTTP request). For instance, in the image above, the User Defined Variables config element is applied/processed to all the samplers in the Thread Groups defined.
Functions and parametrizations
Functions
There’s a variety of functions available out of the box when you use JMeter. Those functions can populate values in your fields dynamically.
A function call looks like this: ${__functionName(var1,var2,var3)}
For example, in a sampler, you may want to know which thread in a thread group is doing the request. You can use the ${__threadNum} function to add the number of the thread currently being executed to the name of the sampler.
Parametrizations
There are ways to parametrizes JMeter test plans. The following ways are the ones who are the most common in usage: using variables within the test plan, using external properties that come from an external file, such as CSVs or through the command line.
Variables: Variables can be set in different objects. They can be used using the ${} pattern. For example, if you are using the configuration element User Defined Variables, you can define global variables such as a port number that can be reused across your test plan.
Properties: Properties can be used through the ${__properties()} or ${__P()} function. You can use a property file (using the -p or -q parameter) or use the command-line arguments to introduce properties.
CSV Files: CSV files can be used to pass data such as users information to the plan. A good example of this is assume you want to use different users. You could have them mapped into a CSV File and that file used within the test. CSV Files are mapped using the CSV data set config configuration element. Note that 1 line in the CSV file is mapped to 1 thread in a thread group.
Secrets: Azure Load Testing service supports reading and injecting your secrets either from Azure Key Vault or through injection from GitHub Actions/Azure DevOps pipelines. It reads them through a function, $__GetSecret(), that is automatically added (through a plugin). You can read about it here.
Plugins
JMeter can be extended using plugins. As mentioned in the documentation, Azure Load Testing lets you use plugins from https://jmeter-plugins.org, or upload a Java archive (JAR) file with your own plugin code. You can use multiple plugins in a load test.
One interesting plugin is the Throughput Shaping Timer. Pure threads are good when we know the number of active users, but in the reality of things, the users (and their requests) aren’t going to be linear. Instead of playing around with the number of threads and timers to achieve the necessary requests per second (RPS) load level, the plugin takes care of all the details for you and lets you set the number of RPS sent to server through a few configuration settings.
Creating a simple test plan for an API with authorization
In our scenario, we will create a test plan to test the performance of a Web API. An API usually (I’m hoping!) has a layer of authorization to protect its sections. We will go and fetch a token and use that token to call our Web API.
JMeter objects setup
First step is to add a Thread Group. Thread groups, as mentioned earlier, are the foundation of a test plan.
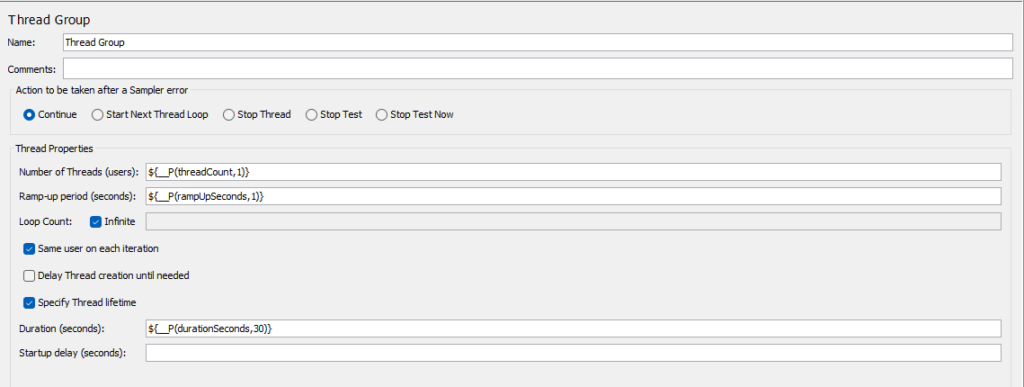
Here, you can see I’m using properties to control some of the Thread Group properties. I have the loop count checked as infinite with the thread lifetime. This means that the thread will continue forever until the duration set in the duration field is up, after which the thread will be killed.
Once you’ve added the Thread Group, right click on the Thread Group and add a HTTP Request sampler. That HTTP Request sampler will be used to go and grab a JWT from the Security Token Service (STS) in this case, Azure AD. In the basic tab, I set the parameters as follow. Note that I added variables which we will setup once we finish with the base of our test plan flow.
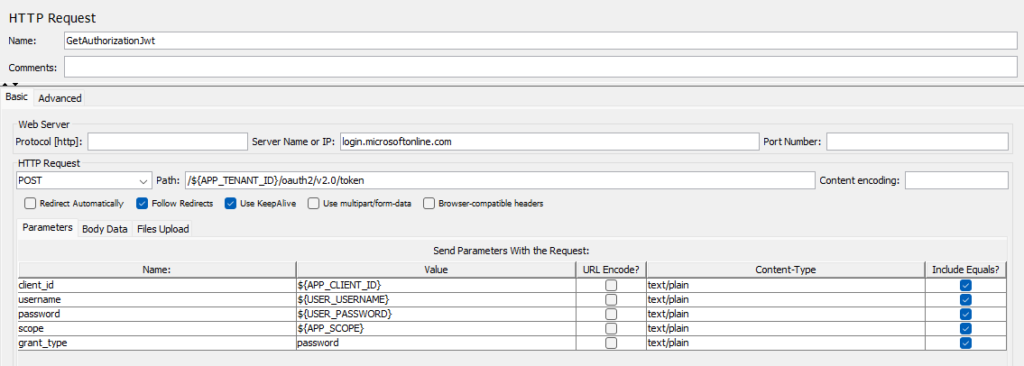
As stated in the documentation, Microsoft recommends you do not use the ROPC flow. In most scenarios, more secure alternatives are available and recommended. This flow requires a very high degree of trust in the application, and carries risks that are not present in other flows. You should only use this flow when other more secure flows aren’t viable.
RPOC may not work in your environment as it should be highly secured (for instance with MFA). How to exclude certains users from MFA is not covered in this article.
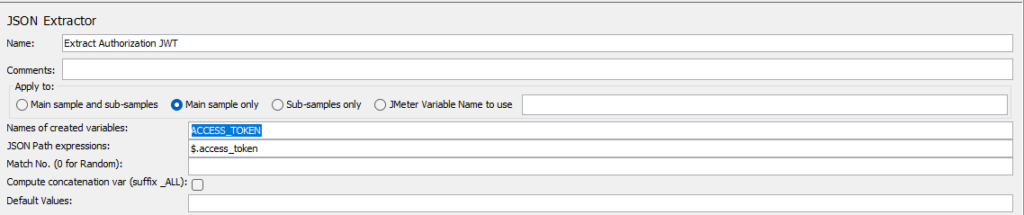
Now, you may ask, how do I get the access token to be able to call my API? You will add a JSON Extractor (from the post processors section) under the HTTP Request sampler scope. Using this extractor, we will be able to extract the access token from the response and map it to a JMeter variable that we will be able to use in our next request.
Once we have the Thread Group, HTTP Request sampler and JSON Extractor, we can add another HTTP Request sampler to make the actual request to the API. This a sampler that you should be familiar with, so you can enter the required information. The only difference here is that you will use the Body Data tab for the JSON payload for the API.
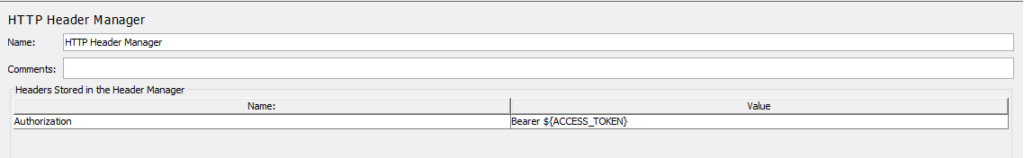
Once you have added the sampler, we need to make sure the access token is sent along the request. Under the sampler scope, add a config element, HTTP Header Manager, to set the Authorization header.
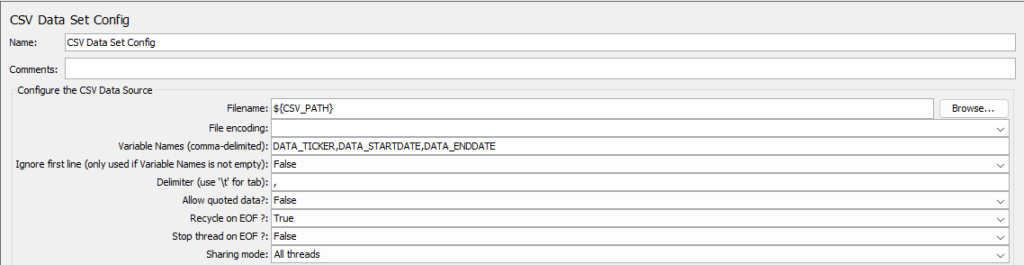
Note that I also added a CSV Data Set Config element. The reason behind is because I want requests sent to my API to be a bit more customized, so that the load test doesn’t hit the same endpoint with the same data all the time.
Pay attention to the parametrization of the filename. I’m not hardcoding the path or filename here. This is because Azure Load Testing uploads your csv files in the same directory as the test plan (JMX file). Thus, I have the ability to control this (if ever they change this), through a variable that is supplied in my User Defined Variables element.
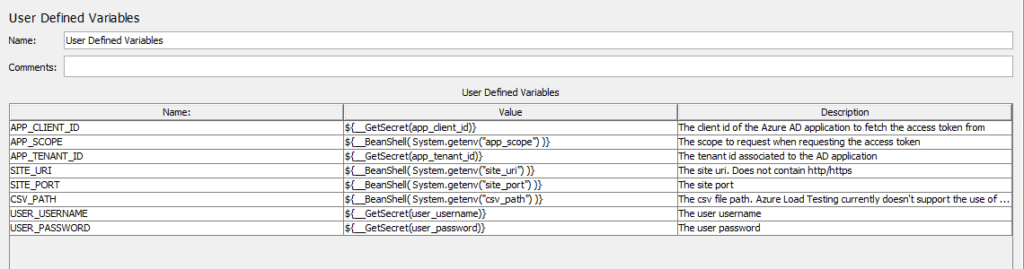
To have a control on the variables that were set in my test plan, I have a User Defined Variables element created. This allows me to control how I want to feed those variables, either through environment variables or other ways, such as custom functions.
The bulk of the sample test plan is done. The HTTP Request Defaults element is just to set the https protocol to all HTTP Request Samplers that are used.
To help us debug and see our test plan results, we will add 2 extra components: A View Results Tree listener to capture the results as they are being processed and a Debug Sampler, to capture JMeter’s variables and properties. You can add both under the Thread Group, at the end of the last HTTP Request Sampler.
Here is what your test plan should look like:
Note how I named my Http Request Sampler, GetStock. This will be important when defining the load test failure criteria.
Starting a test in GitHub
The documentation is pretty good when it comes to integrating a load test into your CI/CD workflow. This is a great way to determine if you introduced regressions within your application.
The way to configure your test run is to use a YAML configuration file. You can see a sample in my repository. Once your configuration file is set, you can use the GitHub Azure Load Testing action to run the test.
In my case, for illustration purposes, here is my YAML configuration file for the load test and my GitHub Action workflow that triggers the load test:
Load Testing YAML Configuration File
|
1 2 3 4 5 6 7 8 9 10 11 12 13 14 15 16 17 18 19 |
# https://learn.microsoft.com/en-us/azure/load-testing/reference-test-config-yaml version: v0.1 testId: StockAPITests displayName: VeloByte Stocks API Tests testPlan: TestPlan.jmx description: Load test the VeloByte Stocks API engineInstances: 1 properties: userPropertyFile: loadtest.properties configurationFiles: - data/tickers.csv failureCriteria: - avg(response_time_ms) > 1000 - percentage(error) > 50 - GetStock: avg(response_time_ms) > 100 autoStop: errorPercentage: 80 timeWindow: 60 splitAllCSVs: True |
What I want to get your focus on is the failureCriteria. As you see the third failure criteria is determined by the result of the GetStock HTTP Request Sampler. The name of the Sampler and the key of the failure criteria need to match.
You may see that I am using a user properties file. This is to control the Thread Group thread properties as mentioned earlier. Here’s what that file looks like:
|
1 2 3 4 5 |
# User properties for testing load threadCount=30 rampUpSeconds=30 # run continously for 5 minutes then, kill the thread durationSeconds=300 |
GitHub Action
|
1 2 3 4 5 6 7 8 9 10 11 12 13 14 15 16 17 18 19 20 21 22 23 24 25 26 27 28 29 30 31 32 33 34 35 36 37 38 39 40 41 42 43 44 45 46 47 48 49 50 51 52 53 54 55 56 57 58 59 60 61 62 63 64 65 66 67 68 69 70 71 72 73 74 |
# see the documentation here: https://github.com/marketplace/actions/azure-load-testing name: Azure Load Test Demo run-name: Run the API load test on VeloByte Stocks API 🚀 permissions: id-token: write contents: read # Allows you to run this workflow manually from the Actions tab on: workflow_dispatch: jobs: run-load-test: runs-on: ubuntu-latest environment: Demo steps: - name: Checkout GitHub Actions uses: actions/checkout@v2 # configured using OIDC # OIDC documentation: https://learn.microsoft.com/en-us/azure/active-directory/workload-identities/workload-identity-federation-create-trust?pivots=identity-wif-apps-methods-azp#configure-a-federated-identity-credential-on-an-app # Action documentation: https://github.com/Azure/login - name: Login to Azure uses: azure/login@v1 continue-on-error: false with: client-id: ${{ secrets.AZURE_CLIENT_ID }} tenant-id: ${{ secrets.AZURE_TENANT_ID }} subscription-id: ${{ secrets.AZURE_SUBSCRIPTION_ID }} - name: 'Azure Load Testing' uses: azure/load-testing@v1 with: loadtestConfigFile: loadTestConfig.yaml loadtestResource: ${{ vars.LOAD_TEST_RESOURCE_NAME }} resourceGroup: ${{ vars.RESOURCE_GROUP_NAME }} env: | [ { "name": "app_scope", "value": "${{ vars.APP_SCOPE }}" }, { "name": "site_uri", "value": "${{ vars.SITE_URI }}" }, { "name": "site_port", "value": "${{ vars.SITE_PORT }}" }, { "name": "csv_path", "value": "tickers.csv" } ] secrets: | [ { "name": "app_client_id", "value": "${{ secrets.APP_CLIENT_ID }}" }, { "name": "app_tenant_id", "value": "${{ secrets.APP_TENANT_ID }}" }, { "name": "user_username", "value": "${{ secrets.USER_USERNAME }}" }, { "name": "user_password", "value": "${{ secrets.USER_PASSWORD }}" } ] |
Here, what I want you to put the emphasis on is the env and secrets properties. This is how the User Defined Variables are populated and can be parametrized.
Debugging
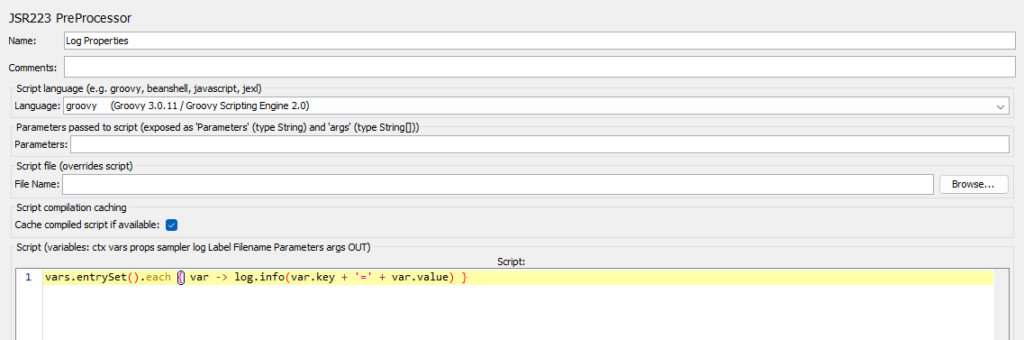
You probably want to debug what is happening. JMeter comes with the log object that you can use to log data. In my scenario, I used a JSR223 Pre-Processor, along with a one line code script, to log all the variables that were set in my User Defined Variables element. You could also use a JSR223 Post-Processor, with the same logic, if you would want to include the extracted access token.
Unfortunately, anything below the WARN log level (that is INFO log level and below) is not currently supported in the product. Currently Azure Load Testing records only WARN and ERROR log messages.
Results in Azure Load Testing
Once your test run is done, you will have access to the results of your test run. This is what my test run looked like:
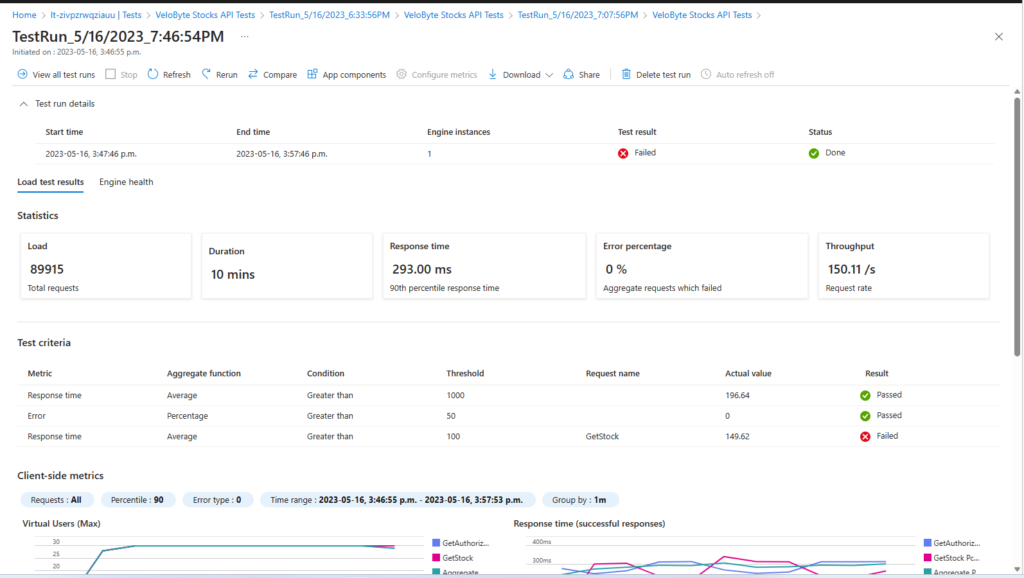
You have the ability to download the assets that were used to run the test, the worker log and the results of the Samplers, in CSV format. Those assets can be found under the Download menu.
Unfortunately for me, I will have to do some optimization on the GetStock method if I want to be below 100ms.
Conclusion
Azure Load Testing service allows you to easily create load testing scenarios on your applications. Using JMeter scripts, you can tailor your scenario much more efficiently to your needs and scenarios.
If you wish to see an example on an actual front end application, you can check out the sample located in the Azure Samples on GitHub.
I have not covered Azure DevOps in this post, but if there’s enough demand, I will do a subsequent post covering Azure DevOps for this scenario. Please do contact me if you would want to see this.
Happy testing!